
How’s The Market?  Which One?

The first question is fairly common.  The second question is quite rare.  Why?  Because there are numerous stock market indexes and from the narrowest to the broadest there is a huge difference in the stocks included and their returns.

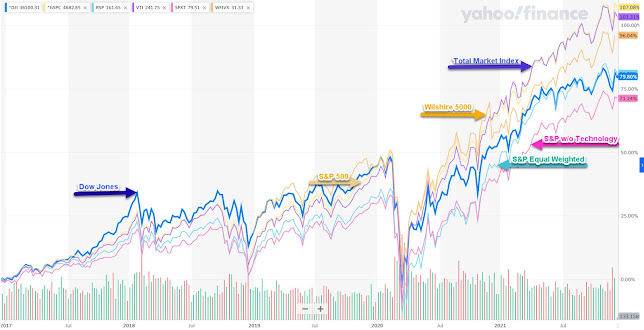
The best-known index is the Dow Jones Industrial Average, which is composed of 30 of the largest U.S. companies.   The Dow, like most other indexes, is a biased reflection of market performance.  The obvious reason is that it is a small sample, albeit that of the largest companies.  Less obvious, but more important, is that the index movements are primarily driven by the higher priced stocks in the group.

Professional investors pay more attention to the Standard & Poor’s 500 Index, the movements of which often vary substantially from those of the Dow.  The S&P is weighted by the market value of the companies’ shares, which means that the biggest companies in the group have the greatest impact.  In recent years, major technology companies such as Meta (née Facebook), Apple, Amazon, Netflix, and Alphabet (née Google) have been the main engines for gains.

A more accurate portrayal of how the S&P has been doing is seen by viewing the Invesco S&P 500 Equal Weight exchange-traded fund, which equally weights all the companies included, so the changes in the prices of the smallest companies have the same impact as those of the giants.

The ProShares S&P 500 Ex-Technology exchange-traded fund takes this one step further by measuring the S&P 500 without the 70 technology companies that are in the index.  That slices off about 30-35% of the aggregate value of the companies covered, but it also shows that the typical returns from most stocks are far lower.

Rather than narrowing, Vanguard’s Total Market Index exchange-traded fund includes a total of 4,124 different stocks.  Even broader is the Wilshire 5000 Index Fund, which (no surprise) includes 5,000 stocks.

From top to bottom, the returns over the latest five years have differed greatly.  The top returns were from the S&P 500 and the Total Market Index, both of which had a massive tech bias.  The lowest returns were from the Dow and the S&P 500 ETF ex-the tech stocks.  The gains for the latter pair were about one-third lower than for the top two.

So when someone asks you about the market, you need to ask which one.

N. Russell Wayne, CFP®

Sound Asset Management Inc.

Weston, CT  06883

203-222-9370

www.soundasset.com

www.soundasset.blogspot.com

Any questions?  Please contact me at nrwayne@soundasset.com


Comments

Popular posts from this blog

Sound Advice: March 10, 2021

The ABCs of Stock Picking After decades of analyzing stocks (and funds) and investing for clients, I'm happy to share in plain English what's involved, what works, and what doesn't.  Keep in mind the reality that successful stock picking is an effort to maintain a good batting average. In baseball, a batting average of .300 or better is considered quite good.  With stock picking, you need to do better than .600, which means you have many more winners than losers. No one gets it right all of the time.  It's not even close.  Wall Street shops all have their recommended lists and the financial media regularly hawk 10 stocks to buy now. Following that road usually is a direct route to disaster.  Don't be tempted. Let's begin with the big picture: The stock market goes up and down over time, but the long-term trend is up.  When there's a rally under way, everyone feels like a genius.  When the market hits an air pocket, though, with few exception...

Sound Advice: January 3, 2025

2025 Market Forecasts: Stupidity Taken To An Extreme   If you know anything about stock market performance, you can only gag at the nonsense “esteemed forecasters” are now putting forth about the prospective path of stocks in the year ahead.   Our cousins in the UK would call this rubbish.   I would not be as kind. Leading the Ship of Fools is the forecast from the Chief Investment Strategist at Oppenheimer who is looking for a year-end 2025 level for the Standard & Poor’s Index of 7,100, a whopping 21% increase from the most recent standing.   Indeed, most of these folks are looking for double-digit gains.   Only two expect stocks to weaken. In the last 30 years, the market has risen by more than 20% only 15 times.   The exceptional span during that time was 1996-1999, which accounted for four of those jumps.   What followed in 2000 through 2002 was the polar opposite: 2000:      -9.1% 2001:     -11.9% ...

Sound Advice: January 15, 2025

Why investors shouldn't pay attention to Wall Street forecasts   Investors shouldn't pay attention to Wall Street forecasts for several compelling reasons: Poor accuracy Wall Street forecasts have a terrible track record of accuracy. Studies show that their predictions are often no better than random chance, with accuracy rates as low as 47%   Some prominent analysts even perform worse, with accuracy ratings as low as 35% Consistent overestimation Analysts consistently overestimate earnings growth, predicting 10-12%                 annual growth when the reality is closer to 6%.   This overoptimism can                 lead investors to make overly aggressive bets in the market. Inability to predict unpredictable events The stock market is influenced by numerous unpredictable factors, including geopolitical events, technological changes, and company-specific news.   Anal...